Advanced Farming Tutorial
Step 1
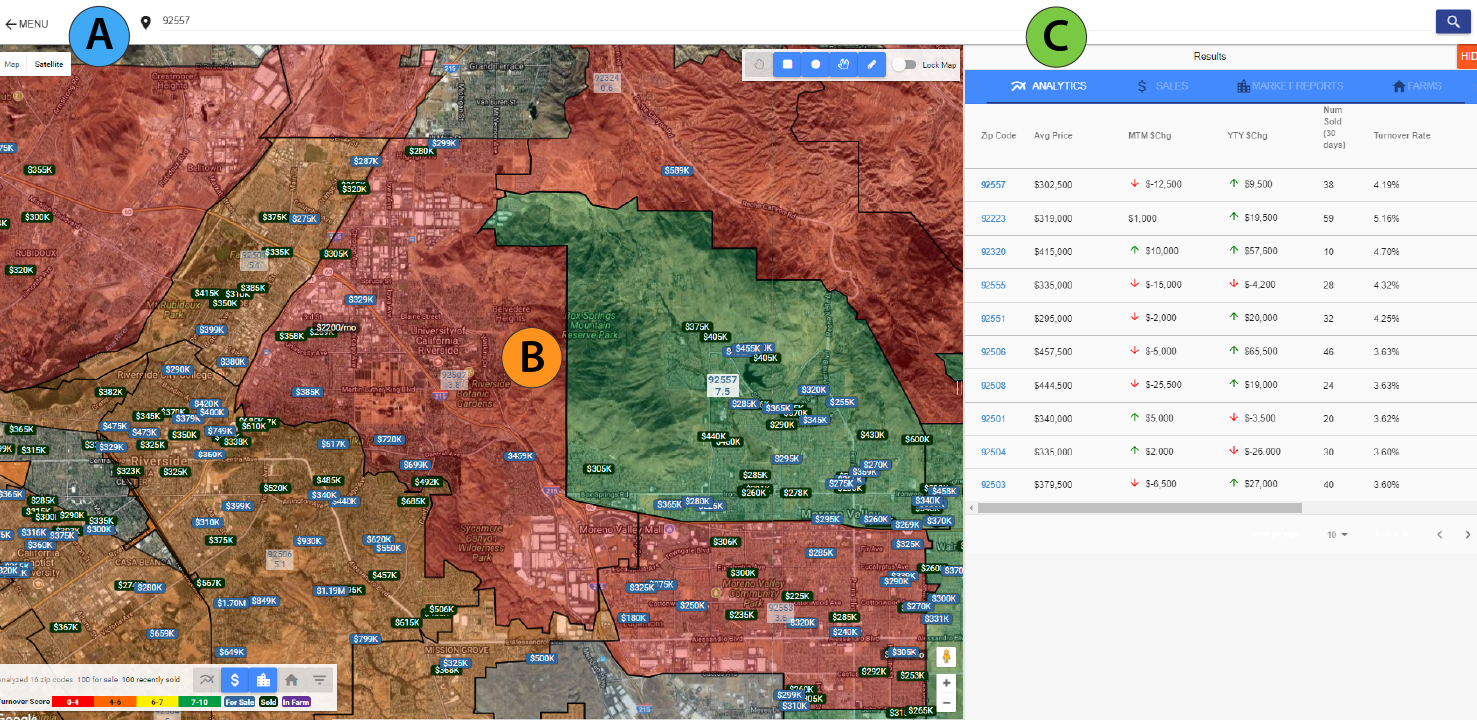
A) Start your search by city, zip code, or a specific address.
B) The colors on the map correspond with the sales volume of the region, also known as the Turnover Rate. Green indicates higher sales volume, while red indicates lower volume.
C) The data in the Analytics table corresponds with the region in the map view. Clicking zip code in the first column centers the map on the region.
Step 2
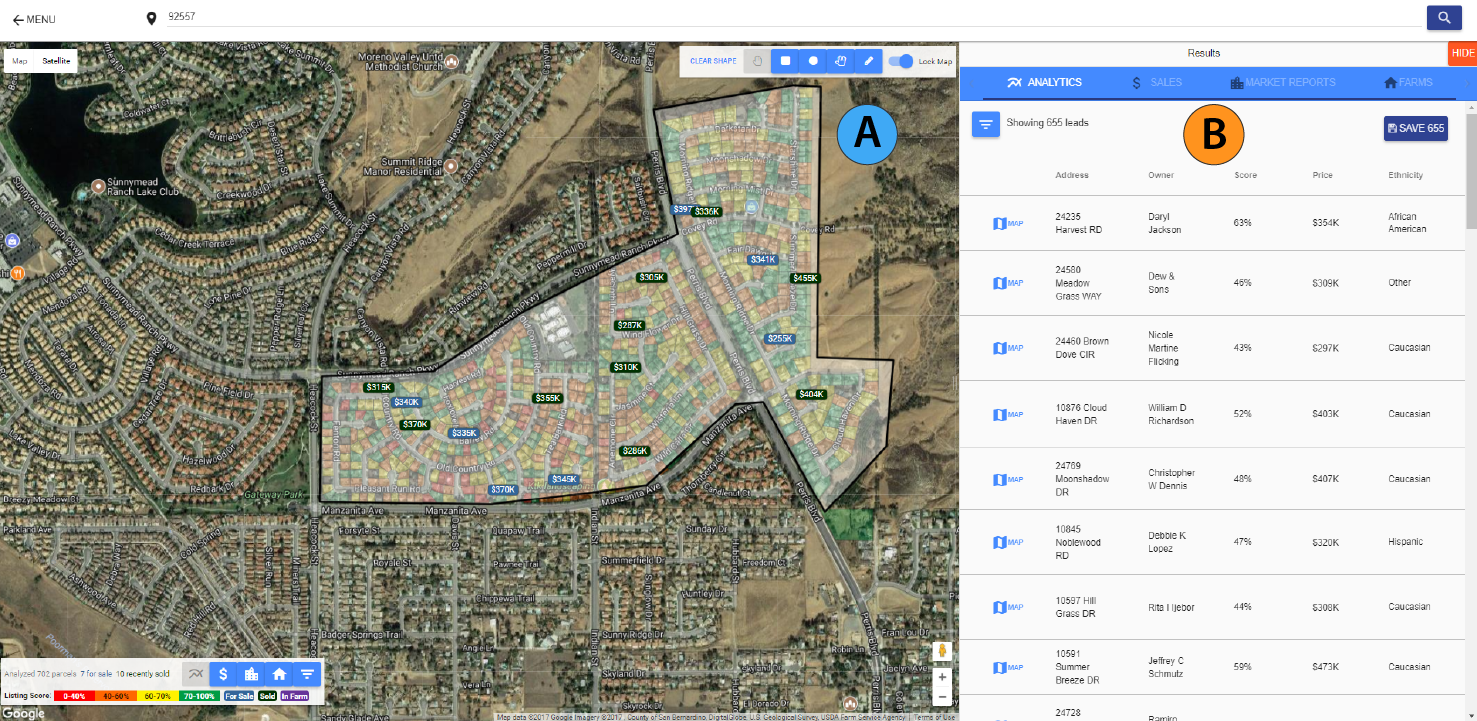
A) Zooming down into the neighborhood-view, the color of the property corresponds with the owner's Listing Score. Use the draw tools in the top right corner of the map to select a subset of homes to save to your FARM.
B) Preview owner data for the FARM in the Analytics table. Clicking a parcel on the map shows the owner's Listing Score, demographic information, property details, Seller Lead Report, and more.
Step 3
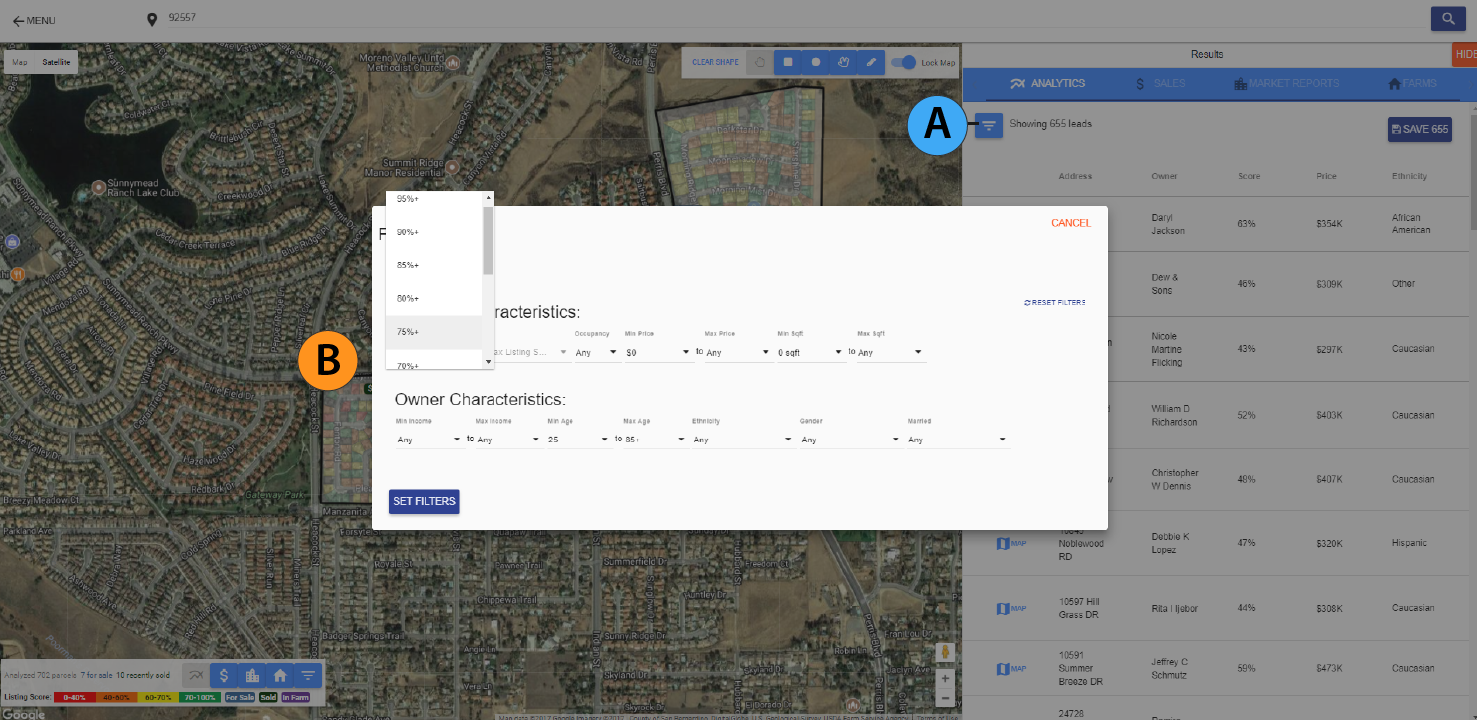
A) Click the filter button to bring up the filter selection dialog box. Filter by the Listing Score, property characteristics, occupancy status, and owner demographics: age, income, ethnicity, gender, and marital status.
B) Filter by the Neighmo Score to find the property owners who most likely to sell in your FARM.
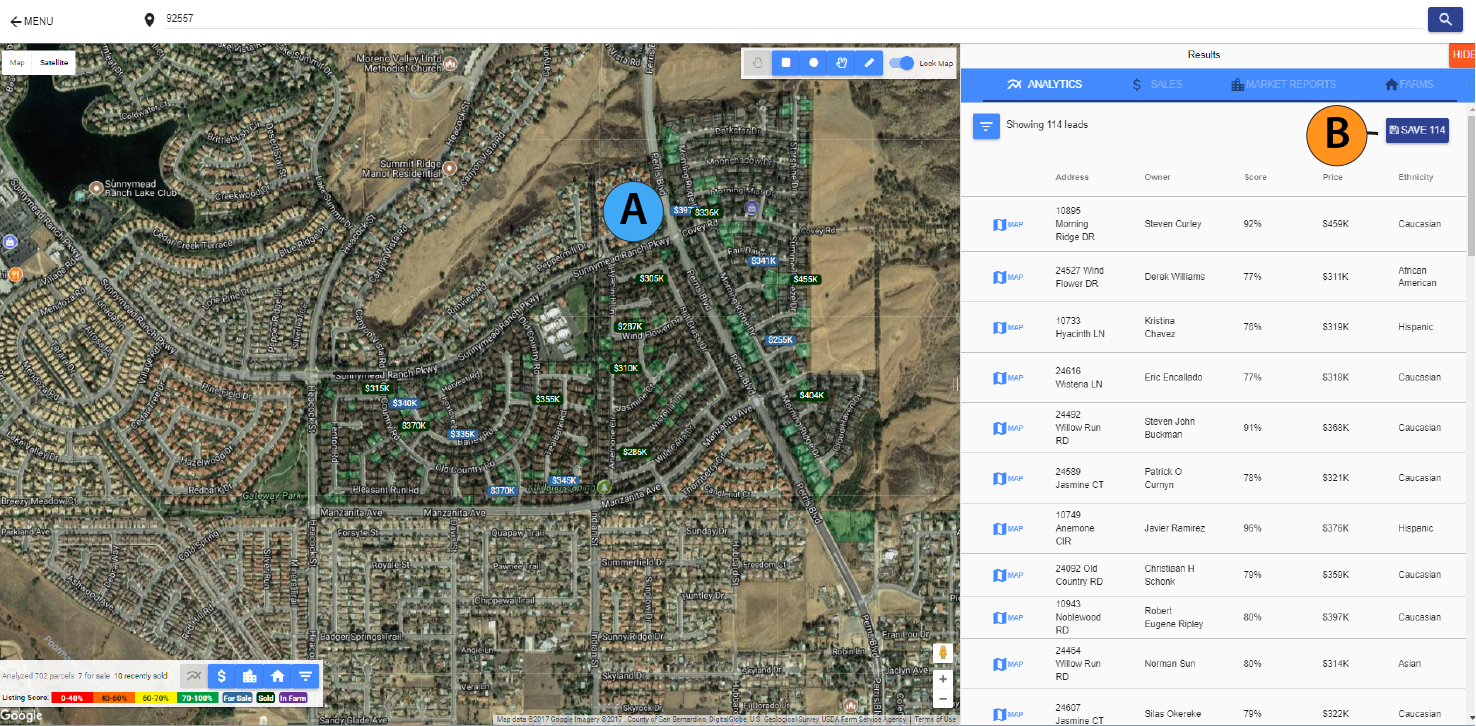
Step 4
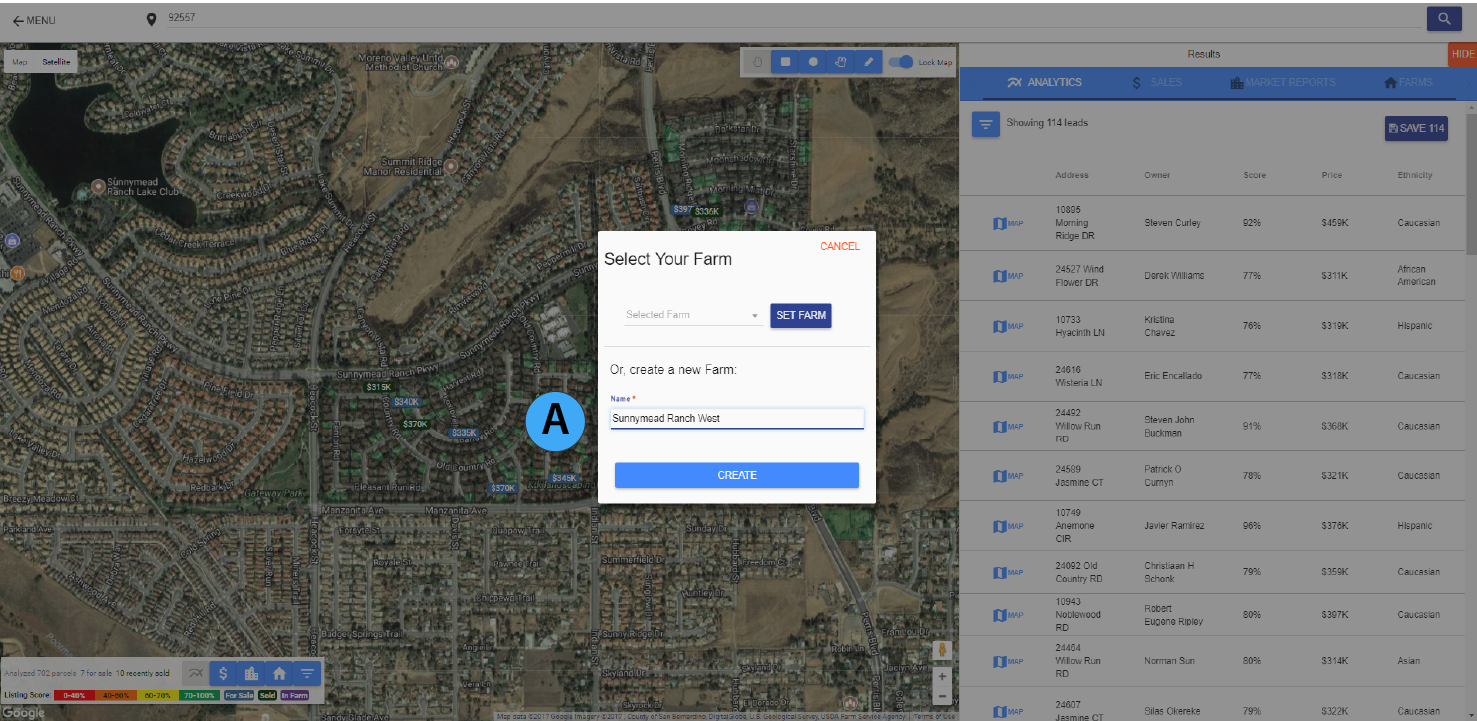
A) After selecting homeowner's with a Neighmo Score above 75%, we've narrowed our FARM from 655 to 114 homes.
B) Click the Save button in the Analytics table to generate your FARM.
Step 5
A) Enter a unique name for your FARM based on location or other criteria you decide. If you have an existing FARM on the map, you can add homes to it by selecting it from the Select Farm dropdown menu.